The visualization plugin offers a set of functionalities to allow the user to interact with the layout.
Contents
[edit]
[edit]
It is possible to navigate the layout by pressing the right mouse button and move the view arround.
Zooming[edit]
Zooming is possible using the mouse wheel or alternatively using the Zoom Panel in the right panel of the visualizer interface (more about the interface here).
Dragging[edit]
If a node is fixed it is possible to drag it to a new position. Simply press the left mouse button and drag the node to the desired position(see more about dragging, fixed and unfixed nodes here).
Highlight[edit]
It is possible to highlight nodes by hovering the mouse cursor on them.
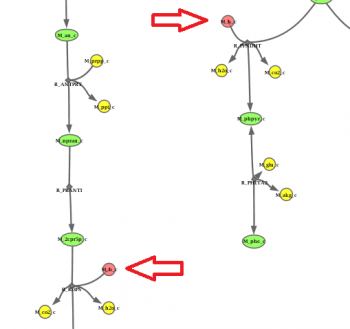
If the node is a metabolite node, all nodes that represent the same compound will be highlighted as well.

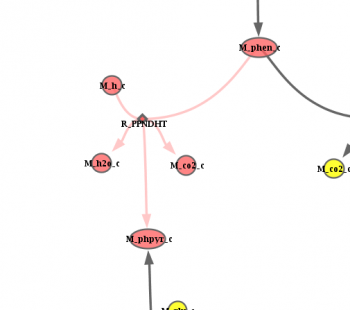
If the node is a reaction, all the metabolites and edges that compose that reaction will be highlighted.

Preferences[edit]
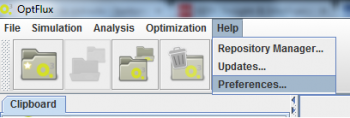
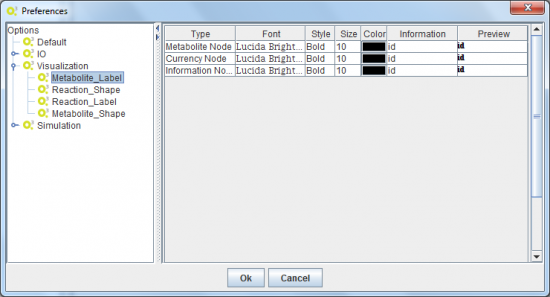
Using the Preferences menu accessible through the Help -> Preferences menu and selecting Visualization in the tree, the user can edit several properties of the network such as colors, shapes and fonts of the nodes.

