You can access
the "Flux Variability Graph" option under the "Analysis -> Flux Variability Analysis" menu or
right clicking on the Project/Metabolic Model icon on the clipboard.
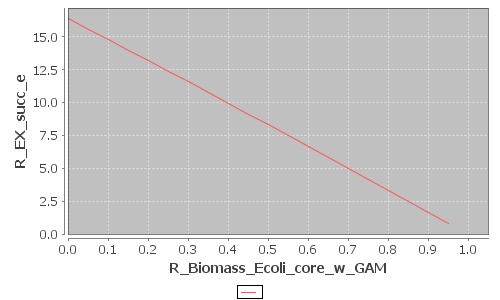
This option allows you to calculate, for a given flux, the maximum possible value, for different levels of minimum biomass flux. After these calculations are done, the values are plotted in a graph, where the X axis represents the biomass levels and the Y axis represents the maximum value of the flux. The simulations are always performed using Flux Balance Analysis (FBA).

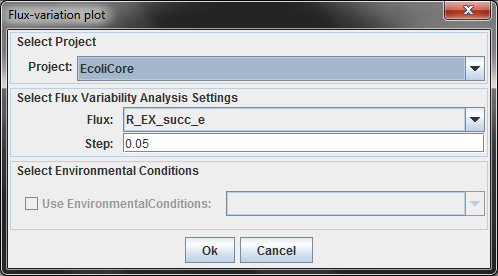
You can select the model/project to work, and set up the graph configuration.

1.Select Flux Variability Analysis Settings
Choose the flux that you want to see in the graph (Y axis) and the step value (related to the biomass, defines the scale of the X axis).
2.Select Environmental Conditions
If you have created environmental conditions you can select them to be use as constraints.
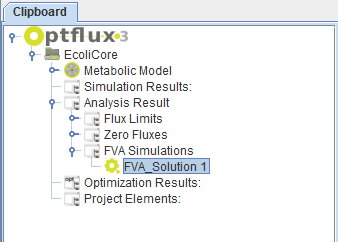
Press OK, and you will see the generated graph as a new element in the clipboard.

And here is an example of a graph:
