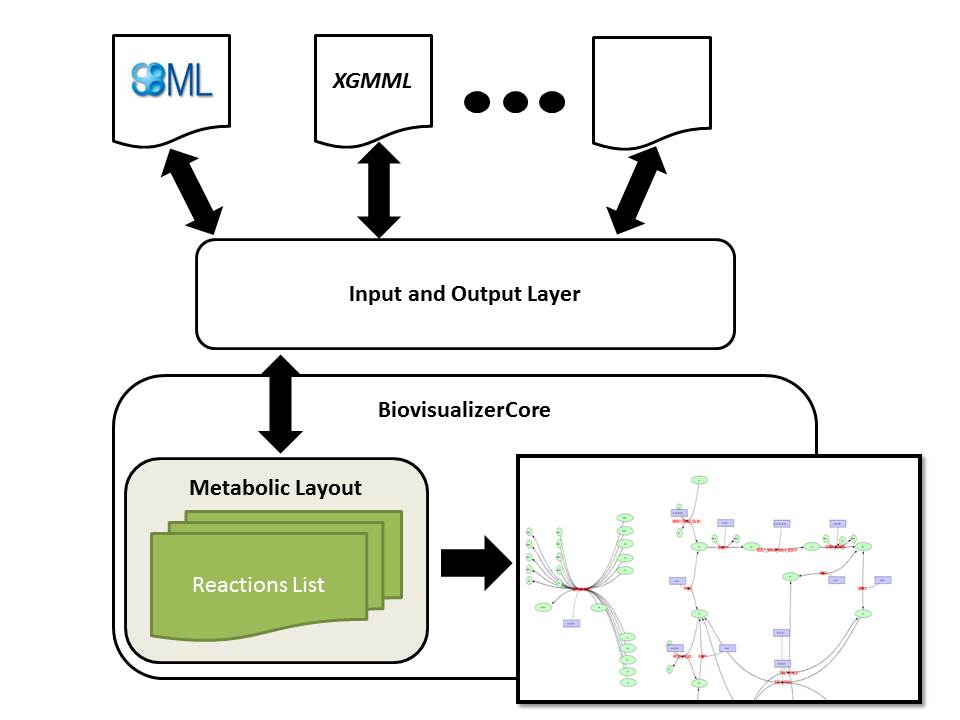
Biovisualizer Core provides a visual representation of a metabolic model. The network is represented as a graph, where biological entities (reactions and metabolites) are represented as nodes, and their interactions (consumption and production) as edges. The architecture of the visualizer library has two distinct layers: the BiovisualizerCore contains the specification of a visual representation of the metabolic network (layout), the tools to represent it in a 2D interface and methods for visual manipulation of the network; the second layer, the Input/Output layer, consists in the readers and writers for a variety of formats that can provide layouts to the BiovisualizerCore, working as a transformer receiving a file in a specific format, reading it and generating a layout.
The visualizer provides:
Visual filters
Metabolic information
Simulation results visual representation
Elementary Flux Modes representation
To import and export layouts for OptFlux check the plugins:
CellDesigner Plugin
XGMML Plugin

