From Optflux
Contents
Example file
You can download it here ->
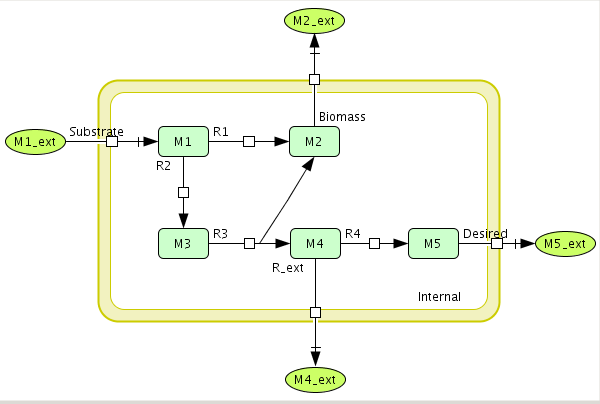
An illustrative of this model can be show below.
The simple network is constituted of seven reactions. The reactions: Disered, Biomass and substrate represents the production of the chemical of interest, the formation of biomass and the uptake of metabolite M1 from surrounding media, respectively.
The coefficient of reaction 'R2'(M1->M3) are such that two molecules of M1 create one molecule of M3, while the stoichiometric coefficients of all other reactions reflect a one-to-one relationship between molecule quantities.
Brief tutorial
This brief tutorial will help you to begin working with OptKnock4OptFlux.
- To start, you will need load a model in OptFlux.(see how to here). You must be attention to select a correct biomass flux.
Run OptKnock
- 1 - Start by accessing the menu Plugins->OptKnock->OptKnock Optimization.
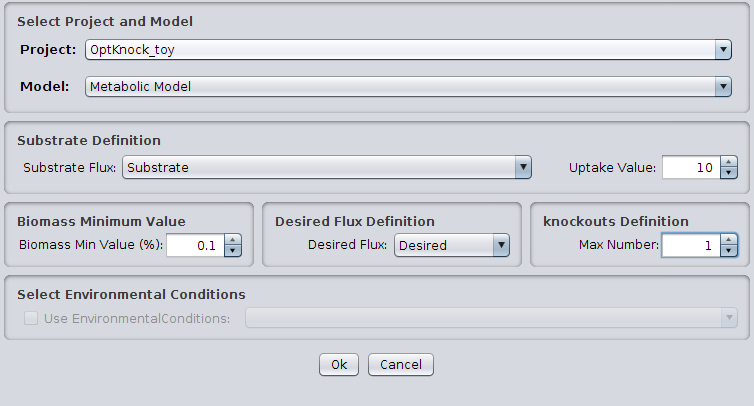
- 2 - The following dialog will be displayed.
- 3 - After execution, a new datatype will be placed in the clipboard, under the simulation list -> elementary modes. Pressing it will launch a default viewer, summarizing the computation process.
Browsing EFMs using the filters
- 1 - Press proceed to filtering or use the context menu (depicted in the above screenshot).
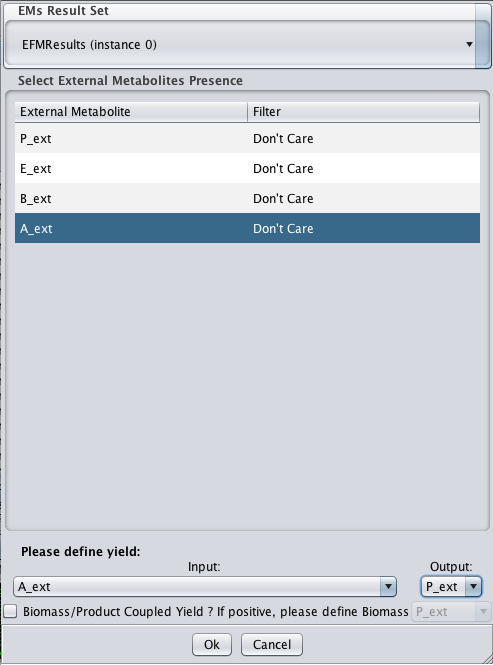
- 2 - You will be presented with the following dialog
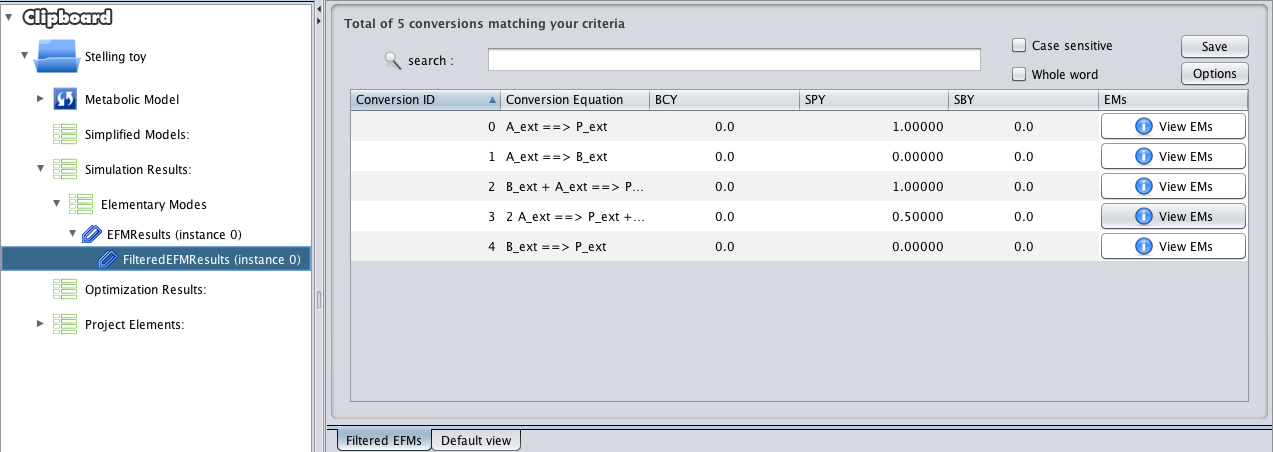
- 3 - You should select which external metabolites you want to appear in the filtered conversions. The whole set of calculated net conversions will be filtered based on those choices. You should also select the desired yield. In the example all the filters are select to Don't Care, meaning that no filtering will actually be applied. The yield is defined as A_ext (Input) -> P_ext (Output). After the filtering step you should expect the following scenario.
- 4 - In this panel you can browse the result of your filtering procedure. You can execute multiple filtring steps over the initial results, they will be added as a list on the bottom of those same original results (in the clipboard).
- This view allows sorting the conversions based on any column criteria (Conversion ID, Conversion Equation (Alphabetically), Biomass-Coupled Yield (BCY), Substrate-Product Yield (SPY) or Substrate-Biomass Yield (SBY)).
- By clicking the View EMs button for any conversion, the list of associated Elementary Modes will be displayed
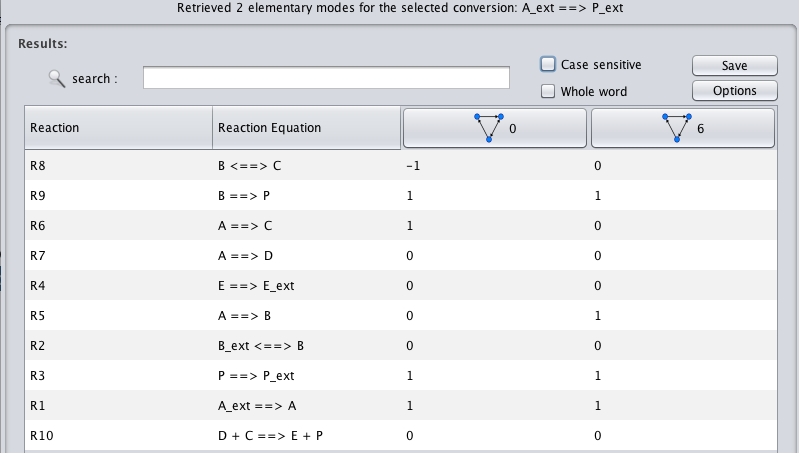
- 5 - In this view, each row relates with a given reaction and each column relates with a given EM. By analyzing this column-wise table you can directly compare each EM for the reactions of your interest.
Exporting Results to CellDesigner
- 1 - In the above view, by clicking the header of each EM column you can export the EM relative values to a CellDesigner compatible file (assuming you loaded one in the beginning).
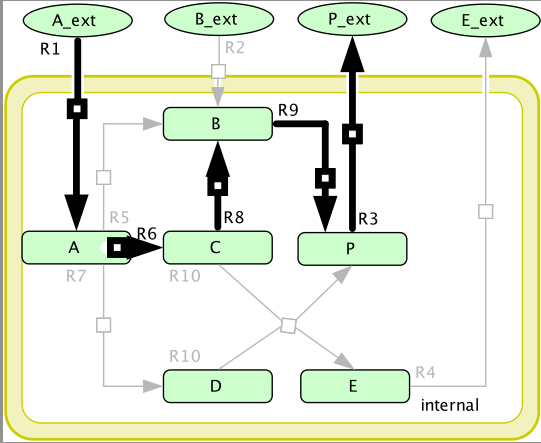
- 2 - Opening the resulting SBML file in CellDesigner will overlap the original CellDesigner layout with line widths reflecting the exported EM.
