The visualization plugin has available some filters and overlaps that will alow the user to get more information about the network and interpret results from OptFlux operations.
Contents
Visual Filters[edit]
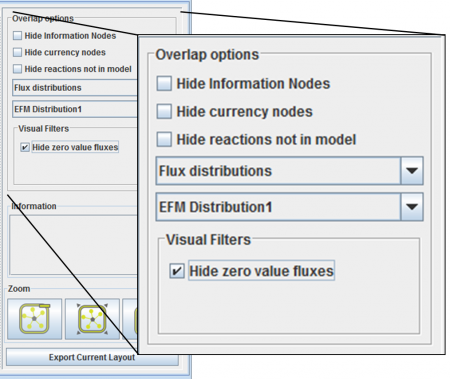
Visual filters can be performed by selecting them in the filters panel (more about the panel in the user interface page).
Each overlap can also have a set of filters associated with it, which will facilitate viusalizing parts of interest in the network.
Overlaps[edit]
There are several kinds of overlaps. In this section they will be described.
Simulation overlap[edit]
A simulation overlap is built from a steady state simulation result from OptFlux.
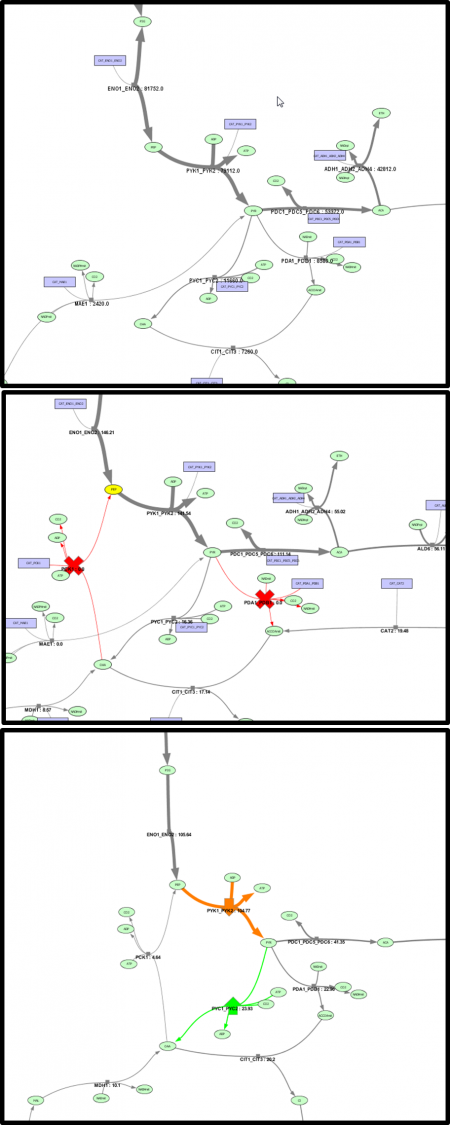
This will allow the user to visualize, in the network, the flux distribution in the network. The thickness of the edges will be changed according to the value of the flux, meaning that reactions with high flux values will have a larger thickness than edges that belong to a reaction with a lower flux value.
The direction of the reversible reactions is also changed according to the flux, to give a better notion to the user the paths that the flux is taking. The label of the reactions also change, presenting the value of the flux.
Finally genetic modifications are also represented as shown below:
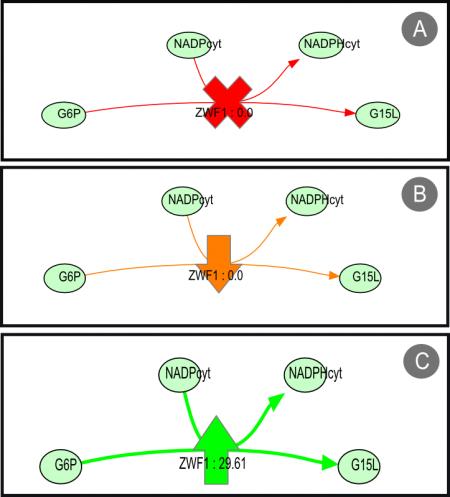
where
A is a reaction knock-out
B reaction under-expression
C reaction over-expression
The overlap also has a filter that will allow the user to hide reactions that have zero value flux. Below are some examples:
Elementary Flux Mode[edit]
In Optflux, there is a plugin that gives the tool the capability to determine the set of Elementary Flux Modes (EFMs) of a model. This plugin also provides an interface that allows filtering the results, including the selection of EFMs based on presence/absence of external metabolites or sorting by yield. It is possible to select sets of EFMs browsing these results, and it is possible to visualize the EFMs in a column-wise table. From this point, it is possible to obtain the flux values for each EFM. The visualization plugin converts these flux distributions to an overlap, in a similar way to the one used for the simulation results. Considering that in this case, we are dealing with simple flux distributions, only the thickness and labels of the edges are passed to the overlap, and a visual filter can be applied that hides the zero value fluxes, allowing a visualization of the EFM in the visualization tool. The overlaps obtained from EFMs are stored in the category "Flux Distributions".
Simulation Comparison[edit]
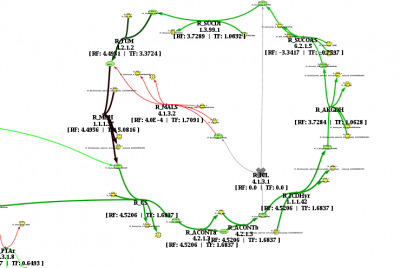
Another type of overlaps was also developed to visualize comparison of simulations. The methodology followed was similar in some ways to the simulation overlaps. The genetic conditions are represented using the same symbols, but the colours of the edges follow a different strategy.
Each simulation will have a colour by default, for instance, simulation 1 will have the colour green, and simulation 2 will have the colour red.
According to the amount of flux of each simulation the colours will vary. If the amount of flux is bigger in simulation 1 then the colours will vary in a gradient that spans from green to black (where black means that there is no difference in fluxes):
If the flux value in simulation 2 is greater, the colours will vary from red to black:
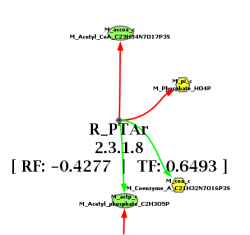
This will allow the user to identify where flux paths differ in the simulations (pure colours) and where both share fluxes (darker colours). At the same time, there can be reactions that are reversible and the fluxes of the compared simulations take different directions, in this case the edges will have the colour of the simulation that follows the direction they are pointing, also giving the user an easy way to understand where the simulations differ:
The thickness of the edges is calculated using the mean of the flux values of both simulations. On top of this some filters are also generated, where it is possible to hide zero value fluxes according to the simulation the user wants to see.
The labels keep the information of the fluxes from both simulations. RF stands for Reference Flux distribution and TF for Target Flux Distribution.
