(→Overlaps) |
(→Elementary Flux Mode) |
||
| Line 34: | Line 34: | ||
=== Elementary Flux Mode === | === Elementary Flux Mode === | ||
| + | |||
| + | In Optflux, there is a plugin that gives the tool the capability to determine the set of Elementary Flux Modes (EFMs) of a model. This plugin also provides an interface that allows �ltering the results, including the selection of EFMs based on presence/absence of external metabolites or sorting by yield. It is possible to select sets of EFMs browsing these results, and it is possible to visualize the EFMs in a column-wise table. From this point, it is possible to obtain the flux values for each EFM. The visualization plugin converts these flux distributions to an overlap, in a similar way to the one used for the simulation results. Considering that in this case, we are dealing with simple flux distributions, only the thickness and labels of the edges are passed to the overlap, and a visual �lter can be applied that hides the zero value | ||
| + | fluxes, allowing a visualization of the EFM in the visualization tool. The overlaps obtained from EFMs are stored in the category "Flux Distributions". | ||
| + | |||
| + | [[Image : C4 EFMvis2.png | 450px ]] | ||
=== Simulation Comparison === | === Simulation Comparison === | ||
Revision as of 15:40, 18 March 2014
The visualization plugin has available some filters and overlaps that will alow the user to get more information about the network and interpret results from OptFlux operations.
Contents
Visual Filters
Visual filters can be performed by selecting them in the filters panel (more about the panel in the user interface page).
Each overlap can also have a set of filters associated with it, which will facilitate viusalizing parts of interest in the network.
Overlaps
There are several kinds of overlaps. In this section they will be described.
Simulation overlap
A simulation overlap is built from a steady state simulation result from OptFlux.
This will allow the user to visualize, in the network, the flux distribution in the network. The thickness of the edges will be changed according to the value of the flux, meaning that reactions with high flux values will have a larger thickness than edges that belong to a reaction with a lower flux value.
The direction of the reversible reactions is also changed according to the flux, to give a better notion to the user the paths that the flux is taking. The label of the reactions also change, presenting the value of the flux.
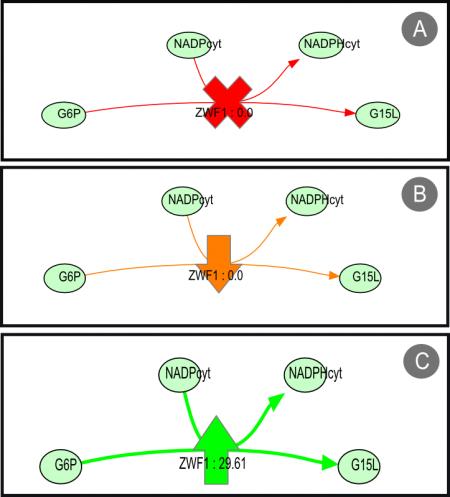
Finally genetic modifications are also represented as shown below:

where
A is a reaction knock-out
B reaction under-expression
C reaction over-expression
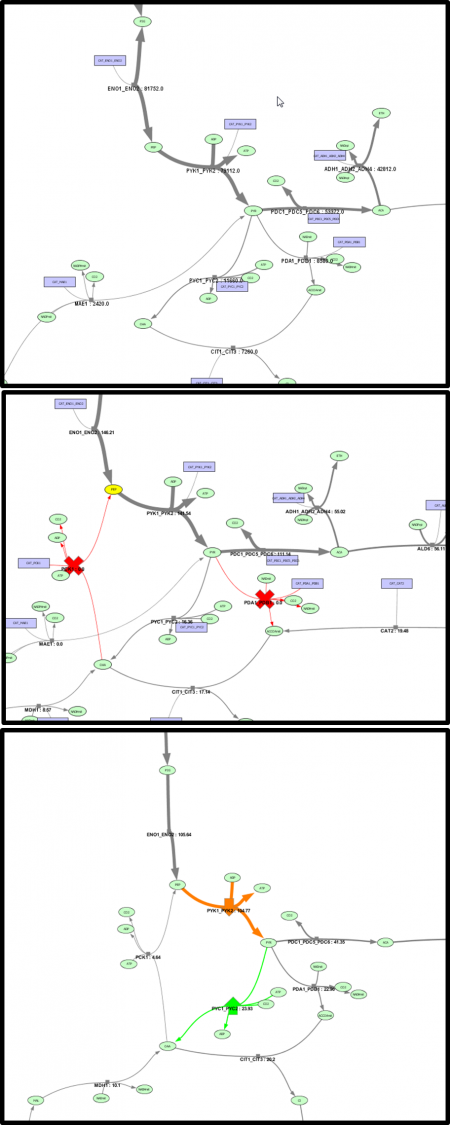
Below are some examples:
Elementary Flux Mode
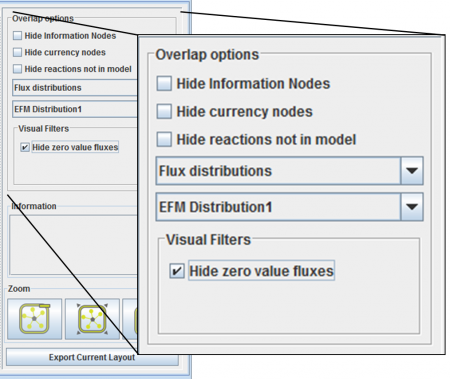
In Optflux, there is a plugin that gives the tool the capability to determine the set of Elementary Flux Modes (EFMs) of a model. This plugin also provides an interface that allows �ltering the results, including the selection of EFMs based on presence/absence of external metabolites or sorting by yield. It is possible to select sets of EFMs browsing these results, and it is possible to visualize the EFMs in a column-wise table. From this point, it is possible to obtain the flux values for each EFM. The visualization plugin converts these flux distributions to an overlap, in a similar way to the one used for the simulation results. Considering that in this case, we are dealing with simple flux distributions, only the thickness and labels of the edges are passed to the overlap, and a visual �lter can be applied that hides the zero value fluxes, allowing a visualization of the EFM in the visualization tool. The overlaps obtained from EFMs are stored in the category "Flux Distributions".

